Flight Analysis
During flights, the DCC will log important information in its internal memory. These data are accessible in a formatted way and can be studied after a flight.
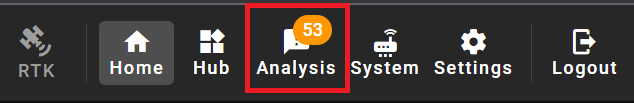
To access it on the operation laptop, and while connected to the DCC interface, go the Analysis page using the navigation bar located on the top-right of the interface or directly by going to https://10.0.0.100/analysis.
On this page, all the previous flights information will appear, the latest flight done will appear at the top.
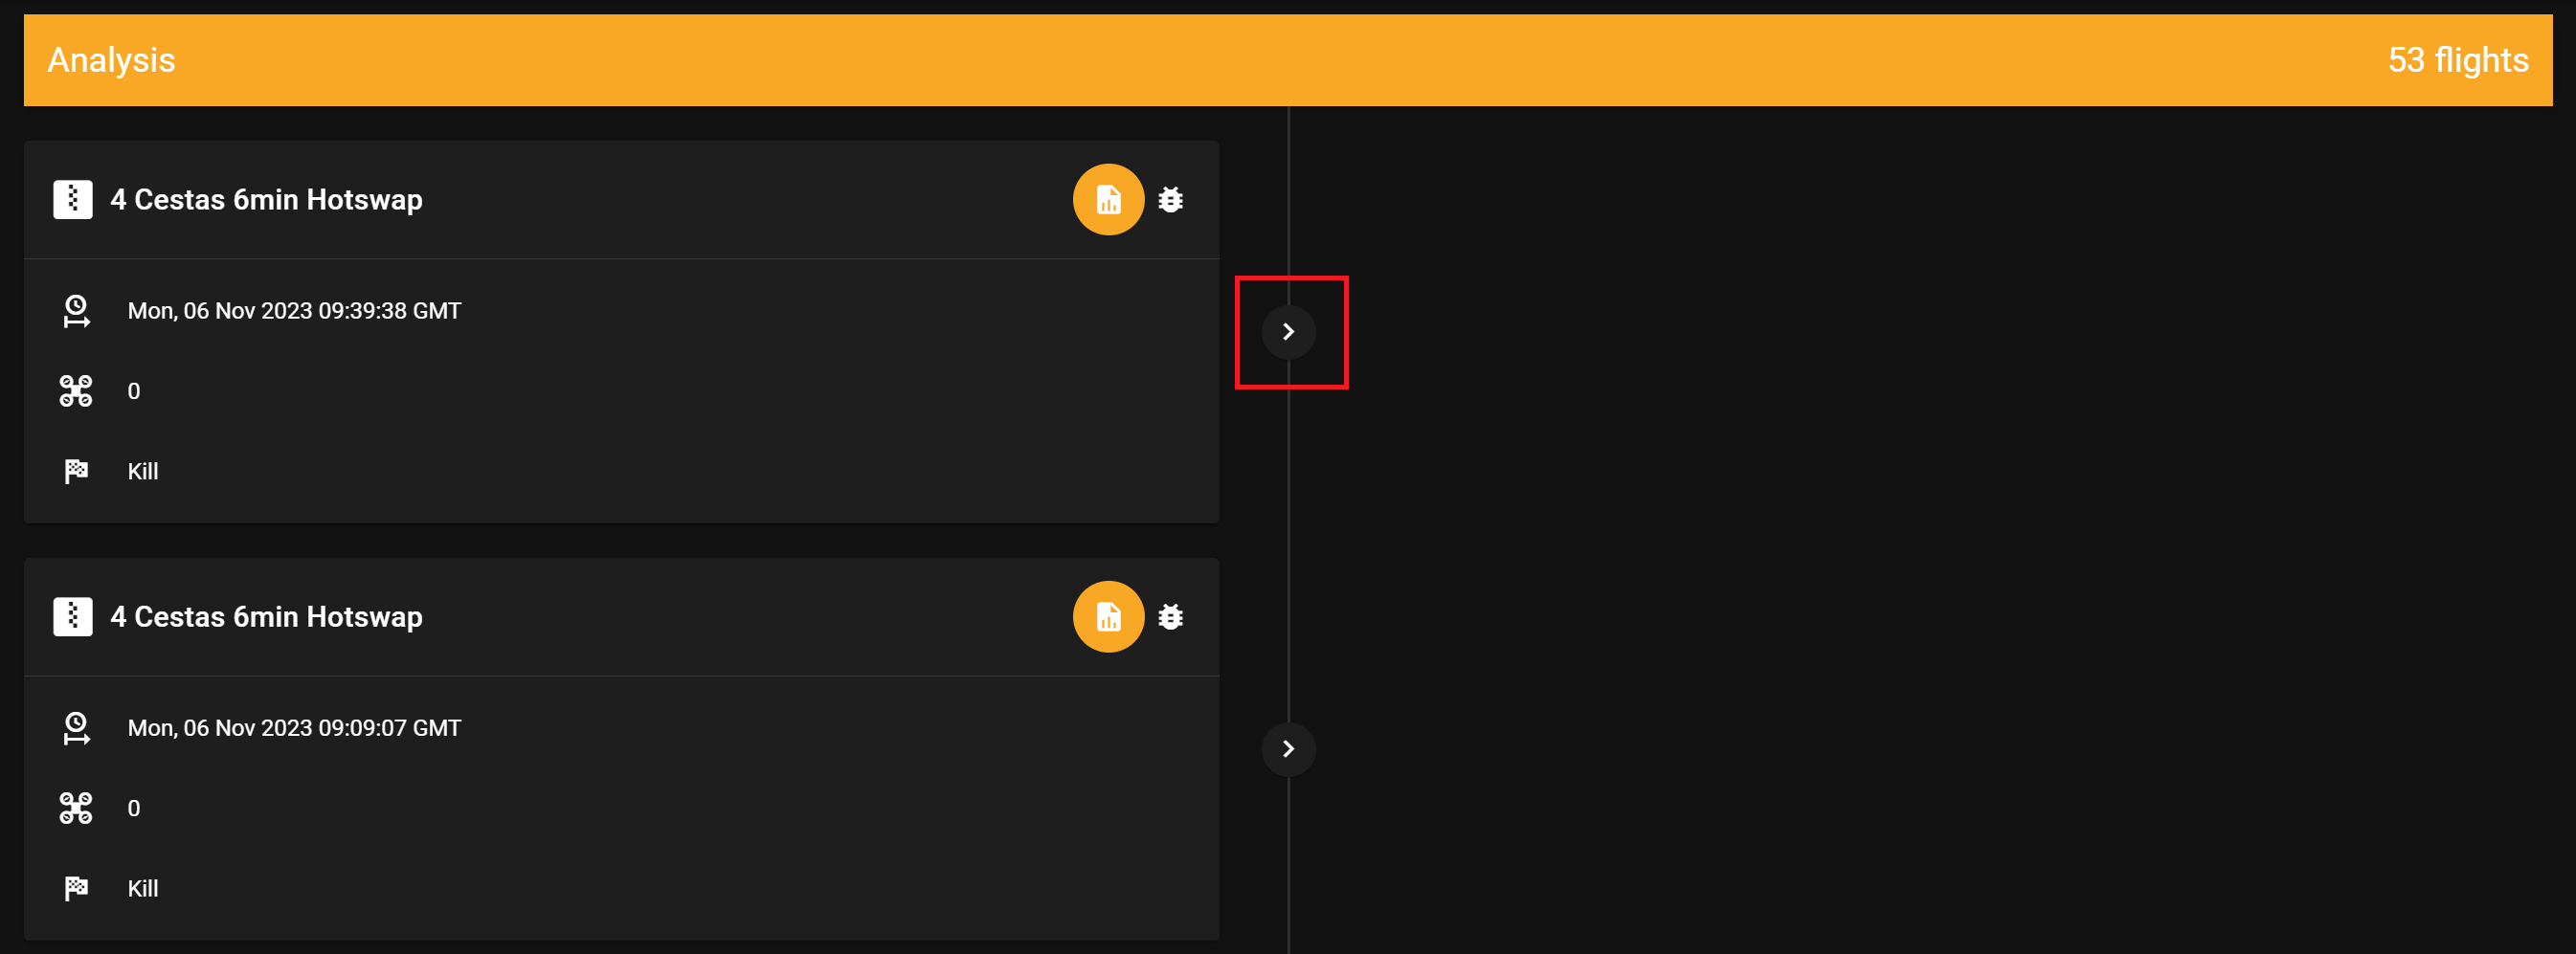
Click on the > button to start the generation of the diverse graphs including the wind graph. The icon will start rotating indicating that the generation is ongoing.

The graphs generation can be quite lengthy, especially for larger flights. However, once the generation is started, the DCC will proceed even if you quit the page. Because of this, it's possible to launch the generation and do something else in the meantime.
Show Report
After every flight, the DCC will automatically generate a pdf report.
To access it click on the Show Report card that should have appeared.
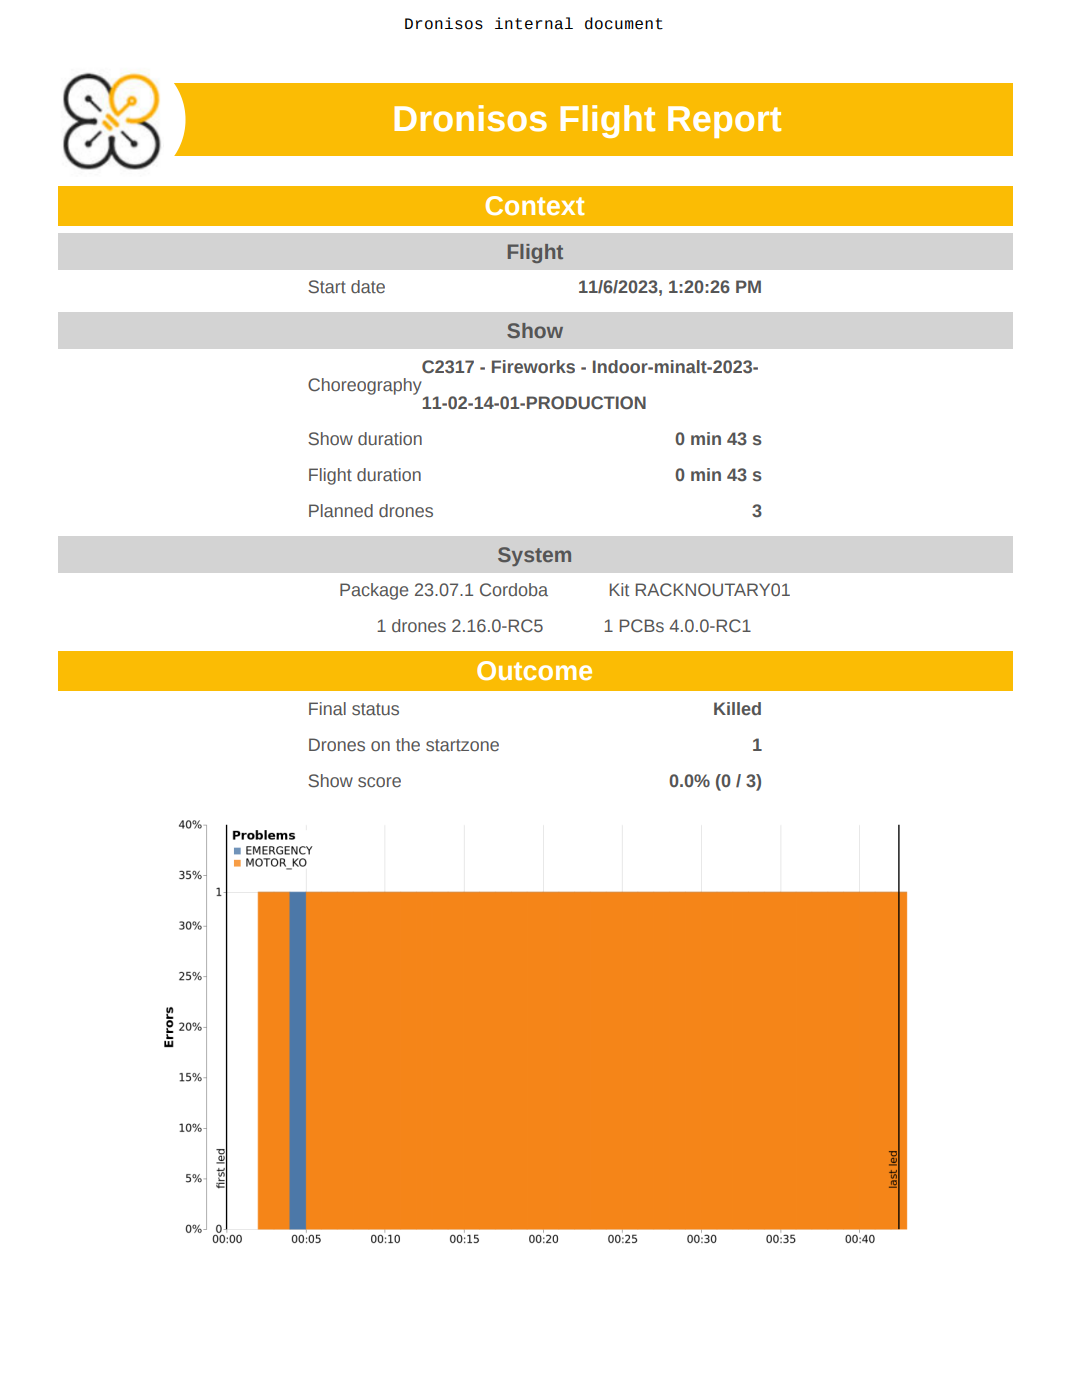
This document, not to be shared to external people, contains all the information of the flight in a concise format.
Please share this document on the Slack channel and/or in Google Drive depending on the specific process of the operation.
Wind Graph
The wind graph is only available for flights that included Zephyrs.
After every flight, retrieving the wind graph from the DCC can be particularly useful to understand why some problems appeared during the flight. However, even if the flight was perfect, it's a good practice to always include the wind graph (and/or the max wind value) to your reports.
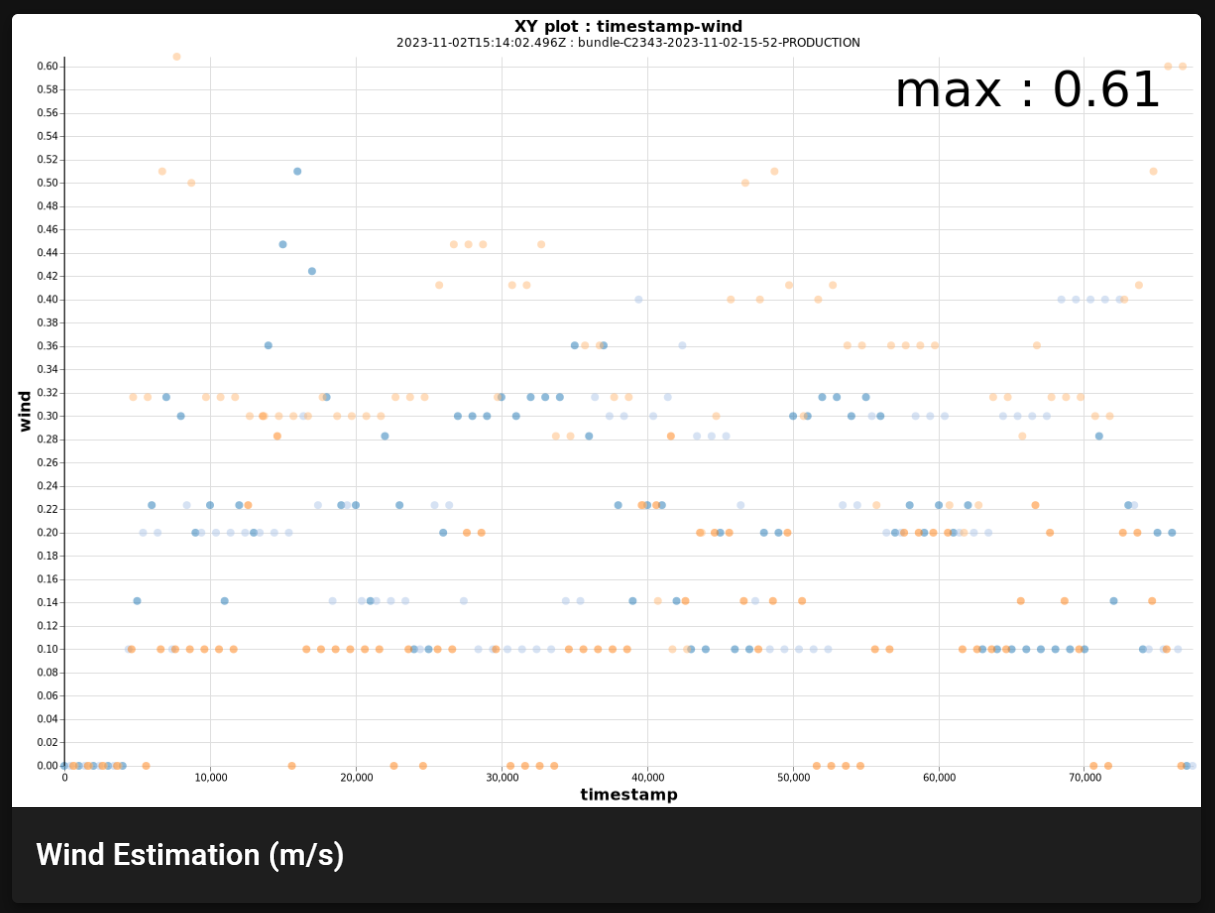
Click on the Wind Estimation (m/s) card that should have appeared.
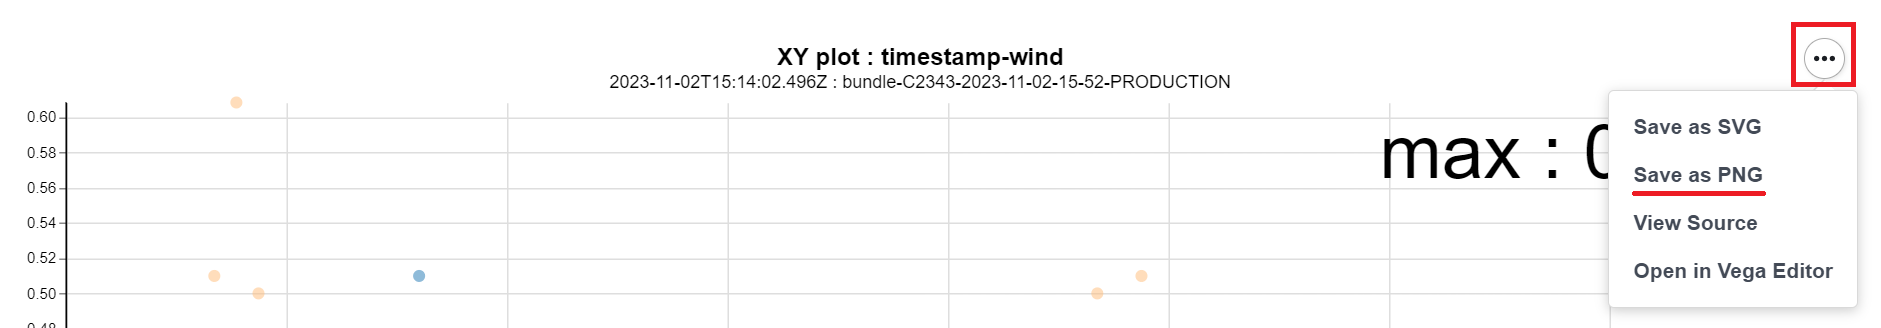
Doing so will open a new tab with the dynamic wind graph. Downloading the wind graph can be done by clicking on the ⋮ button then on Save as PNG
Share this graph on the relevant Slack channel.
How to read the wind graph
One coloured circle on the graph denotes a wind estimation value gathered from the drones. Each colour denotes a particular drone, hence why multiple circles appear multiple times. The abscissa corresponds to the time of the choreography: starting at 0 when the first drone takes-off and ending when the last drone lands.
The maximum value of the dataset will always be displayed in the top-right corner of the graph. This value will be the reference upon which the operator can rely to launch a flight or not, according to the specified max wind limit.